

How much do backlinks cost? Published averages for the same guest post range from $164 to over $1,400. That spread is not noise — it is the whole story. Here is how to read the pricing data and build a model that survives contact with your own numbers.
Pricing figures in this article are drawn from published 2026 industry studies and are current as of August 2026. Rates move; treat every number below as a band, not a quote.
Ask how much do backlinks cost and you will get a number. Ask three sources and you will get three numbers that do not overlap.
Adsy’s 2026 analysis of 52,671 websites puts the average guest post at $459. BuzzStream’s data lands around $461, with high-quality placements averaging far higher. PressWhizz analysed 22,703 actual completed placements from their marketplace and found an average of $164. Agency-mediated pricing has been reported around $1,459 — roughly three to four times direct placement cost.
Same product, allegedly. Nearly a 9x spread.
This is not a case of one study being wrong. Each is measuring something different, and understanding which is which is the difference between a budget that works and one that evaporates in month two.
Why the published backlink pricing figures disagree so wildly
Listed price is not transacted price. This is the single biggest source of divergence. Adsy’s data found that advertised backlink prices run around four times higher than what buyers actually pay. Site owners ask high; buyers negotiate or go elsewhere. Studies built on published rate cards measure aspiration. Studies built on completed transactions measure reality.
Quality bands are not separated. A “guest post” covers both a DR 25 blog with no traffic and a DR 70 publication with editorial standards. Averaging them produces a number describing neither. BuzzStream’s figures separate these and the high-quality band sits several times above the general average.
Agency markup is often invisible. The publisher fee and the service fee get bundled into one line. When a study measures what clients pay agencies rather than what agencies pay publishers, it captures a markup layer of roughly 3–4x.
Geography and niche swing wildly. Core English-speaking markets run substantially above global averages. Reported niche variation is extreme — some verticals sit well above average and others well below.
DR pricing is non-linear. Adsy’s finding is a useful rule of thumb: each additional 10 DR points raises price by around 32% on average. Costs escalate faster than authority does.
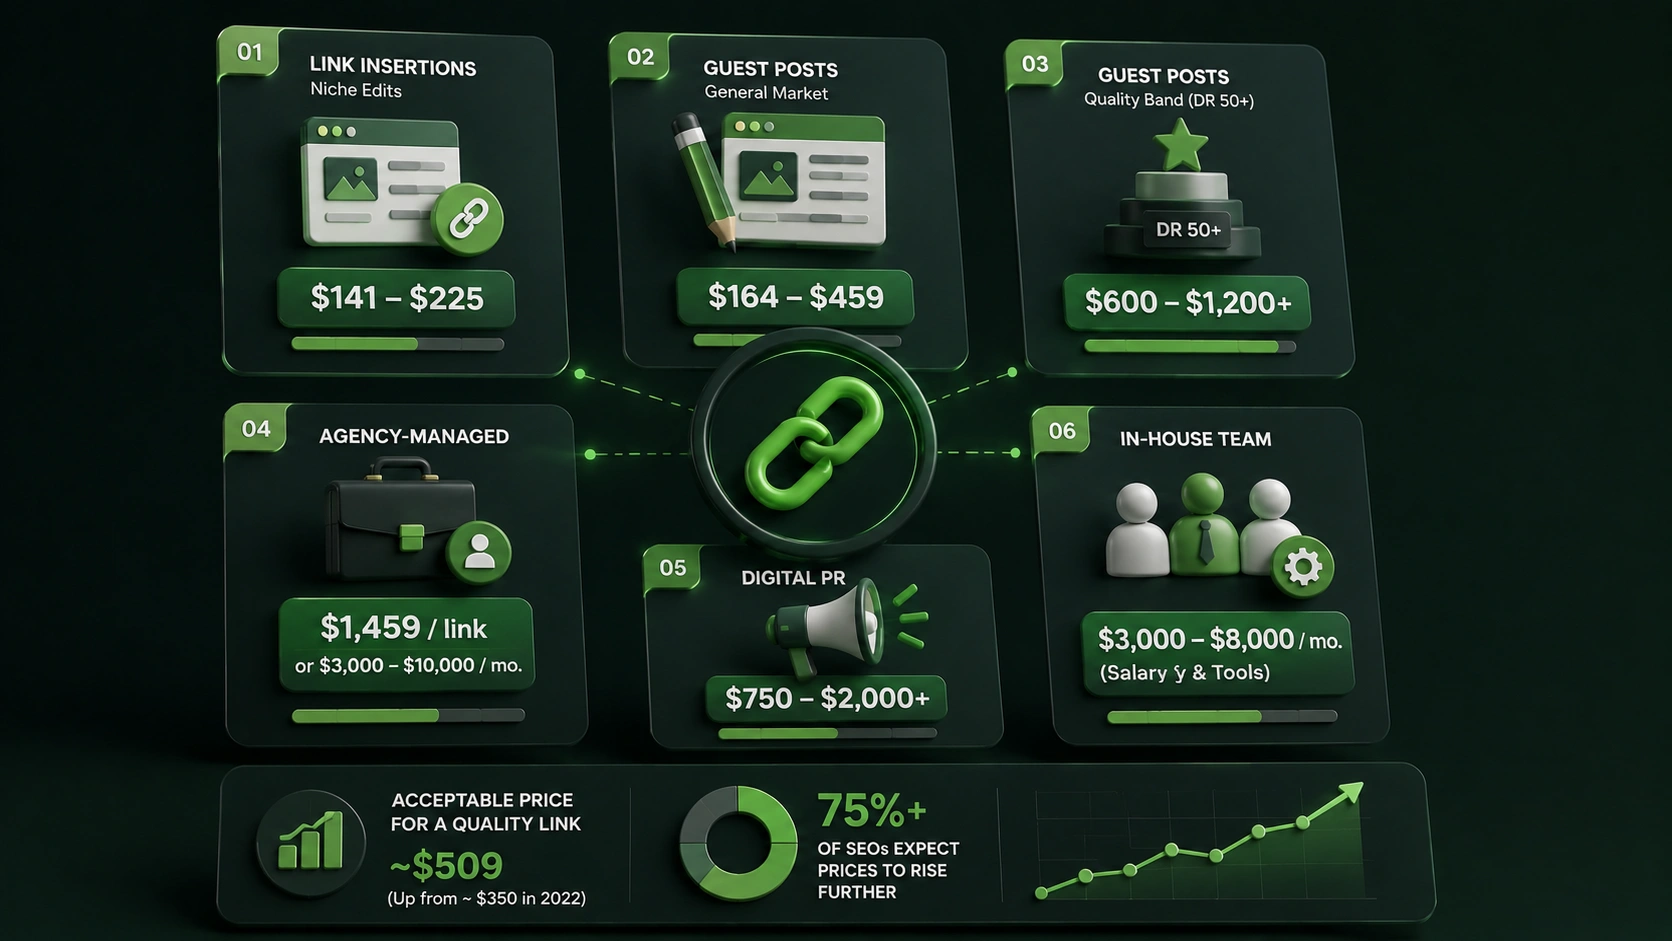
Rough cost per backlink in 2026, broken down by acquisition method
Directional 2026 figures, drawn from the studies above. Treat as bands, not quotes.
- Link insertions / niche edits — roughly $141–$225 average, with quality placements running higher. Consistently cheaper than guest posts because there is no content to produce.
- Guest posts, general market — roughly $164 transacted to $459 listed. The gap is the negotiation.
- Guest posts, quality band — $600 to $1,200-plus for DR 50+ placements with real traffic and genuine editorial standards.
- Agency-managed — around $1,459 per link on average, or $3,000–$10,000 monthly retainers, typically producing 5–15 links a month.
- Digital PR — roughly $750 to $2,000 per link, sometimes more. The most expensive and the best.
- In-house team — $3,000–$8,000 monthly in salary and tooling, before any placement fees.
One market-wide figure worth knowing: the average price SEOs report as acceptable for a quality link now sits near $509, up from around $350 in 2022 — roughly 45% growth in four years. A large majority of surveyed SEOs expect further increases.
The cost everyone quotes wrong: what you really pay per usable link
Here is where budgets break.
The quality studies are brutal and they broadly agree in direction even where they disagree on magnitude. BuzzStream’s analysis found only a small fraction of guest post opportunities meet a serious quality bar — figures reported range from about 1.4% to 7.6% depending on the threshold used, with one analysis finding over 85% of guest post sites fall below DR 40 with under 10,000 monthly visitors.
Take that seriously and the arithmetic changes completely.
If you buy at the $164 average but only one placement in ten meets a standard you would actually defend, your real cost per usable link is not $164. It is closer to $1,640 — or you have spent $164 nine times on links that do nothing.
The cheap tier is not cheap. It is a different product sold under the same name.
This is why buyers who filter properly end up paying prices that look expensive next to the headline averages. They are not overpaying. They are the only ones measuring the right denominator.
The cost nobody models: link decay and cost per surviving link-year
Every figure above is expressed as cost per link. That unit is wrong, because links are not permanent.
Placements disappear through redesigns, content pruning, expired domains, and quiet SEO cleanups. Link rot is the default outcome for any programme without monitoring, not an edge case.
The honest unit is cost per surviving link-year.
A $400 placement that lasts four years costs $100 a year. A $164 placement that vanishes in eight months costs $246 a year — half the sticker price and 2.5x the running cost. You cannot know which you bought at purchase time, but you can measure it afterwards, and almost nobody does.
If you are not tracking survival rate, your reported cost per link is a number that quietly inflates every month after you calculate it.
What link exchange actually costs, stated honestly
Exchange is not free, and any comparison that pretends otherwise is not worth reading.
What you pay:
- An outbound link slot on a page you own, plus the equity that passes with it
- Editorial cost — the placement has to make sense in real content, which means someone writes or edits around it
- Platform cost — credits, if you top them up rather than earning them through placements
- Judgement time — reviewing matches, which you should not skip
What it is not exposed to: publisher rate inflation, agency markup, or a per-link fee that scales linearly with volume. The cost structure is fundamentally different — mostly fixed and internal rather than variable and external.
The honest caveat: paid placements of any kind, including via marketplaces, sit against Google’s link spam policies. That is a risk factor to weigh, not a line item, and it applies across most of the methods priced above.
What the price tag does not tell you about a placement
Two placements at identical prices can be worth wildly different amounts, and price carries almost no information about which is which.
Traffic is priced weakly. DR drives pricing far more than actual audience does. Adsy’s data suggests a site with ten times the traffic charges only modestly more than a low-traffic equivalent at the same DR. That is a mispricing you can exploit: real visitors are the part of a link that pays regardless of how the ranking maths lands, and the market is barely charging for it.
Relevance is priced at zero. Nobody charges more for being in your niche. Yet an in-niche link at DR 40 will usually outperform an unrelated one at DR 60. The market prices a metric; you should be buying a fit.
Neighbourhood is priced at zero. A site that sells placements to everyone is selling you a page that gets worse every month, and its rate card will not mention that. Check outbound profiles before price.
How to build your own link building cost model from your numbers
Stop using industry averages as a budget. Build the model with your own inputs:
- Target links per quarter, based on the referring domain gap between your pages and the pages outranking them — not a round number
- Your quality floor, in DR and minimum monthly traffic, decided in advance
- Expected pass rate at that floor. If you filter hard, assume most prospects fail
- Cost per attempt, including the ones that fail
- Internal hours, priced at what your time is actually worth
- Assumed survival rate. If you have no data, assume attrition and be pleasantly surprised
Multiply through and you get cost per surviving, usable link. That number will be materially higher than any headline average, and it is the only one you can plan against.
Where Linkexchange sits on the cost curve, and why scale changes it
Exchange occupies a different position on the cost curve rather than a cheaper point on the same one. Fixed platform cost, internal editorial cost, and no per-placement publisher fee that grows with volume — which is why the economics improve as you scale rather than degrade.
One line item worth separating out: internal linking is included free, with recommendations generated across your existing articles. It acquires no new referring domains, so it does not belong in a cost-per-link comparison at all — but it is the only lever on this page that improves rankings at zero marginal cost, and it should be exhausted before any of the priced options above.
The Linkexchange plugin runs the cycle inside WordPress: niche matching at the DR floor you set, exchange settlement through credits, referral traffic attributed per link, and continuous monitoring so removals surface immediately.
That last one matters more for your cost model than it looks. Monitoring is what converts cost per link into cost per surviving link-year — and on the evidence above, that is the only version of the number that means anything.
Get started free at linkexchange.ai — 500 credits, no card required. Exchange smarter. Rank higher.