
Link velocity is not a speed limit. The pattern that reads as manufactured is discontinuous acquisition, not fast acquisition — and once you understand that, the operational question becomes shape rather than volume.
Most velocity advice assumes a ceiling: acquire links below some rate and you are fine, above it and you are exposed.
That model does not survive contact with how real profiles behave. A site that publishes something genuinely useful can pick up forty links in a fortnight because it got shared. A news site can acquire hundreds in a day. Speed on its own is not anomalous — it is what happens when something works.
What does not occur naturally is a curve with no plausible cause. That is the actual variable, and it changes what you manage — from a rate you stay under to a shape you maintain.
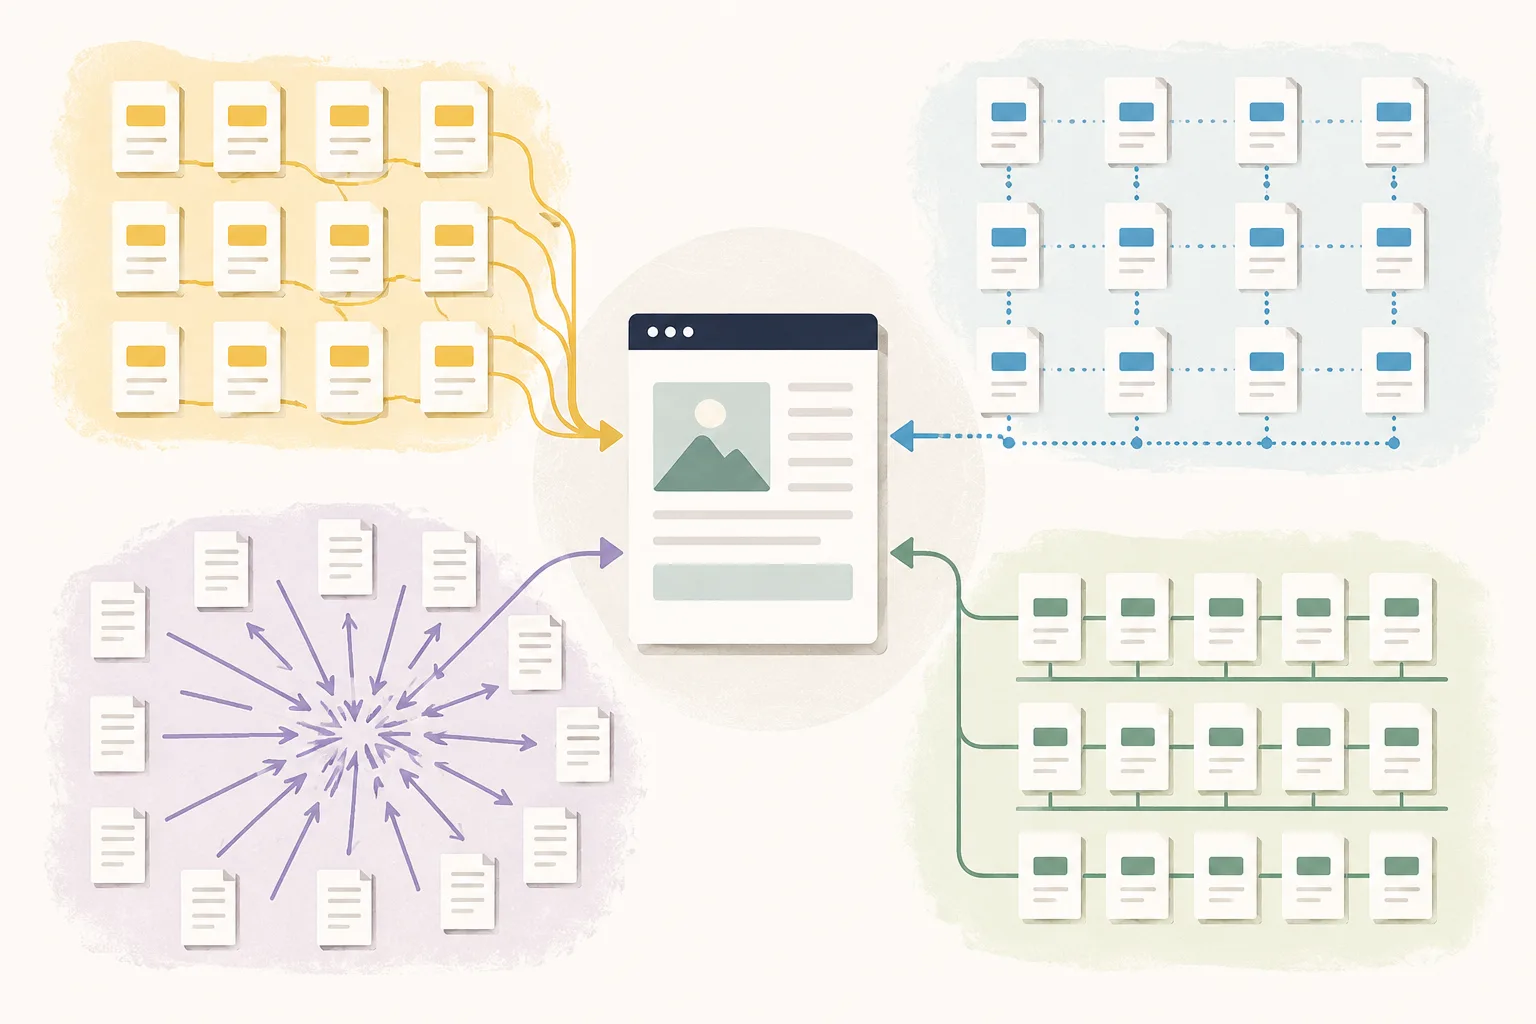
The four patterns that read as manufactured
1. The cliff start. A domain with eleven referring domains acquires thirty in a month. The problem is not thirty. It is thirty relative to eleven. Proportional jumps are far more visible than absolute ones, and new domains have almost no denominator to absorb them.
2. The stop. Programmes that halt dead are as odd as ones that spike. A site acquiring steadily for four months and then nothing for six either stopped being interesting or stopped paying someone. The second reading is the one that matters.
3. The uniform drip. The overcorrection. Exactly four links every month, indefinitely, is not what natural acquisition looks like either. Real profiles are lumpy. A perfectly regular curve is its own signature.
4. Single-target concentration. Twenty links a quarter spread across your site is unremarkable. Twenty a quarter all pointing at one commercial page is a different shape entirely, regardless of pace — and it compounds with anchor concentration, since links to one page tend to share anchors. The advanced link exchange strategy guide treats velocity as one of several footprint controls precisely because they reinforce each other.
Working out your own rate
Use a proportional figure rather than an absolute one. Three inputs.
Your current referring domain count. Domains, not backlinks.
Your historic monthly acquisition rate. Average the last six to twelve months from any backlink tool’s new-referring-domains report, excluding anomalous spikes.
Your competitors’ rate. Run the same report on two or three sites currently outranking you for your target term. This is the input almost nobody bothers to get, and it is the one that tells you what normal looks like in your niche rather than in the abstract.
Then apply a working heuristic: monthly acquisition somewhere in the range of 5–15% of your existing referring domain count is unremarkable for most sites. Practitioner rule of thumb, not a Google statement, but it scales correctly where a flat number does not.
Three worked cases
Site A — new, 14 referring domains. Ten percent is 1.4 a month. That sounds painfully slow and it is the correct answer. A four-month-old domain acquiring fifteen links a month has no plausible story for where they came from. Realistic plan: two to three a month for the first quarter, rising to five or six as the base grows. Year one total around 40 to 50 domains, which is a solid outcome.
Site B — established, 220 referring domains, historic rate of 9 per month. Ten percent would be 22, well above its own history. The binding constraint here is not the percentage but the site’s own trajectory. Roughly doubling to 15–18 is a visible acceleration and a defensible one, particularly if content output also rose. Going from 9 to 40 is not.
Site C — 60 referring domains, near-zero acquisition for eight months. The hardest case and the most common among sites that just discovered link building. There is no recent baseline, so anything is an acceleration. Ramp rather than jump: three in month one, five in month two, eight in month three. The shape does the work — a rising curve reads as a site gaining momentum, an instant jump to eight reads as a switch being flipped.
Why exchange specifically needs active pacing
This is a mechanical problem rather than a strategic one, and it catches people who are otherwise careful.

Outreach paces itself. Replies arrive unevenly over weeks, so the links land irregularly whether you planned it or not. The tactic has natural variance built in.
Exchange does the opposite. Campaigns complete in batches, both sides place quickly once terms are agreed, and you can end up with eight links live in nine days without intending to. The efficiency that makes it a good engine is the same property that creates timing clusters.
Four controls:
- Stagger placements deliberately. When a batch is agreed, do not place them all in the same week. Spreading over three to four weeks costs nothing and removes the cluster
- Cap concurrent campaigns. Two or three at once for most sites. More and you lose control of when things go live
- Keep a floor, not just a ceiling. A month with zero placements after four active months is its own signal
- Rotate target pages. Three or four targets rather than hammering one. This spreads the anchor profile at the same time, which is why the link velocity management guide treats velocity and anchor distribution as one control problem rather than two
Where fast is completely fine
You published something that got shared. Original research, a free tool, a data study. The cause is visible on your own site, which is the one situation where a genuine spike is entirely defensible.
You launched, or got covered. A funding announcement, a product launch, coverage that got picked up.
Seasonal niches. Tax software in Q1, gifting in Q4. If your niche has a real season, a flat year-round curve would be the odd shape.
You acquired a site. Migrations and acquisitions produce sharp profile changes for structural reasons.
The common thread: fast is fine when a reviewer could find the cause. It is a problem when the only available explanation is that someone was building links.
How to slow down without stopping
A practical problem that comes up more than the advice acknowledges: you have committed to more placements than you should deploy this month, and cancelling looks worse than proceeding.
Four ways to absorb it without creating a cluster.
Hold placements rather than cancelling agreements. On most arrangements the agreement and the placement are separate steps. Agree now, place across the following six weeks. Partners generally do not mind a stated timeline; they mind silence.
Redirect to different target pages. If the volume is fixed, spreading it across four targets instead of one changes the shape considerably without reducing the count.
Vary placement position and anchor deliberately across the batch. If the timing is going to cluster, make sure nothing else does.
Bring forward organic acquisition. Publish the asset, run the mention sweep, claim the relationship links. Anything that adds unrelated referring domains in the same window dilutes the cluster rather than concealing it.

What does not work is placing everything and hoping. A batch of twelve links going live in nine days, all to one page, with three anchor variants between them, is three patterns at once — and patterns compound rather than adding.
Pacing to the wrong baseline
The failure mode that catches careful people rather than careless ones.
Someone reads advice like this, sets a conservative rate, and paces to it — while their competitors acquire four times faster. A year later they have a defensible curve and have lost anyway, because the gap was never closing at that rate.
Your rate has to clear two bars, not one. Plausible for a site your size, and sufficient to close the referring domain gap on your targets within a timeframe you can afford.
If those are irreconcilable — competitors hold 400 domains and a defensible rate gets you to 60 in a year — the honest conclusion is that velocity is not your problem. The target is. The better move is to pick less competitive terms, build authority there, and return to the hard ones with a larger base. Pacing carefully toward a target you cannot reach is a slower way to lose.
At portfolio scale
Managing velocity across several properties adds two failure modes invisible from inside any single account.
Synchronised curves. If the same person runs acquisition for six sites, those six curves tend to move together — the same busy months, the same quiet ones, the same quarterly rhythm. Six unrelated sites accelerating in the same fortnight is a cross-property pattern.
Shared partner timing. If your properties draw from an overlapping partner pool, links can go live across several of your sites in the same window from the same sources. That combines a timing cluster with a partner overlap problem.
Three controls: offset the campaign calendars deliberately, cap partner overlap between properties, and audit the curves side by side quarterly rather than individually. Overlap caps and audit cadence are covered in the link velocity management guide alongside the other portfolio-level controls.
What to track
Monthly, ten minutes:
- New referring domains against your rolling six-month average
- Distribution across target URLs — how many pages received links, not just how many arrived
- Lost referring domains, because net rate is what matters. A site gaining six and losing four is growing at two
- Curve shape over twelve months. Plot it. Clusters and flat stretches are obvious visually and invisible in a monthly table
That third one is why most velocity calculations are wrong. Attrition is continuous, nobody tracks it, and gross acquisition overstates real growth by a margin you cannot see without checking.