

Acquisition without auditing is how people wake up to a problem they spent eighteen months building. Here is the quarterly check that catches it — seven items, roughly ninety minutes, and the two most people never run.
Most link building programmes measure one thing: how many links were built. That number is the least useful figure available, because it says nothing about what survived, what changed, or what shape the profile has taken.
The audit below is designed to be run every quarter without becoming a project. Seven checks. Nothing that requires a dedicated tool beyond what you already use, and nothing that takes more than twenty minutes on its own.
Before you start
You need one thing: a placement log. Date, target URL, anchor text, partner domain, and whether it went live.
If you do not have one, start it now and run a reduced audit until it has history. Almost every check below is faster and more accurate with a log, and two of them are impossible without it.
Export your referring domains from Search Console and from Ahrefs Webmaster Tools or equivalent. Work from a complete list rather than a filtered view.
Check 1 — Survival rate
What: the proportion of links built more than six months ago that are still live.
How: take the placements from two quarters back, check each URL. In Ahrefs Webmaster Tools the lost backlinks report does most of this; for anything valuable, open the page and search for your domain rather than trusting an index.
Why it matters: link rot is the default for any programme without monitoring. Redesigns, content pruning, expired domains, and quiet SEO cleanups on the publisher’s side remove links continuously and silently. If nothing is checking, your reported referring domain count is above reality and the gap widens every month.
What to do with it: a survival rate you can state is the difference between reporting acquisition and reporting an asset. It also converts cost per link into cost per surviving link-year, which is the only version of the number worth planning against.
Check 2 — Partner drift
What: partners that were clean when you exchanged and have since degraded.
How: sample your top twenty partner domains by value. For each: has the outbound linked-domain count grown sharply? Is there a write-for-us page with pricing that was not there before? Has the content shifted to volume publishing?
Why it matters: partner quality is not a fixed property. A site that met your standard eighteen months ago may be selling placements now, and the page hosting your link degrades with every sale.
What to do with it: flag degraded partners and stop placing with them. Existing links are rarely worth removing — dilution beats removal — but the relationship should end.
Check 3 — Anchor distribution per target URL
What: the category spread and phrase concentration on each commercial page.
How: Ahrefs Site Explorer, mode set to Exact URL, Anchors report. Export with counts, categorise into branded, naked URL, generic, partial match, exact match, and image. Calculate shares, then sort by individual phrase frequency.
Why it matters: anchor concentration accumulates on a page across every campaign and every organic link over its whole life. Managed per campaign, four reasonable campaigns produce an unreasonable aggregate.
What to do with it: if exact match is climbing past roughly a quarter of a commercial page’s inbound anchors, stop requesting it and dilute. Direction matters more than the level — 30% and falling is healthier than 22% and rising. The anchor text distribution guide covers the full audit and the dilution arithmetic.
Check 4 — Velocity shape
What: the shape of your acquisition curve over twelve months, not the monthly number.
How: plot new referring domains per month. Actually plot it — clusters and flat stretches are obvious visually and invisible in a table.
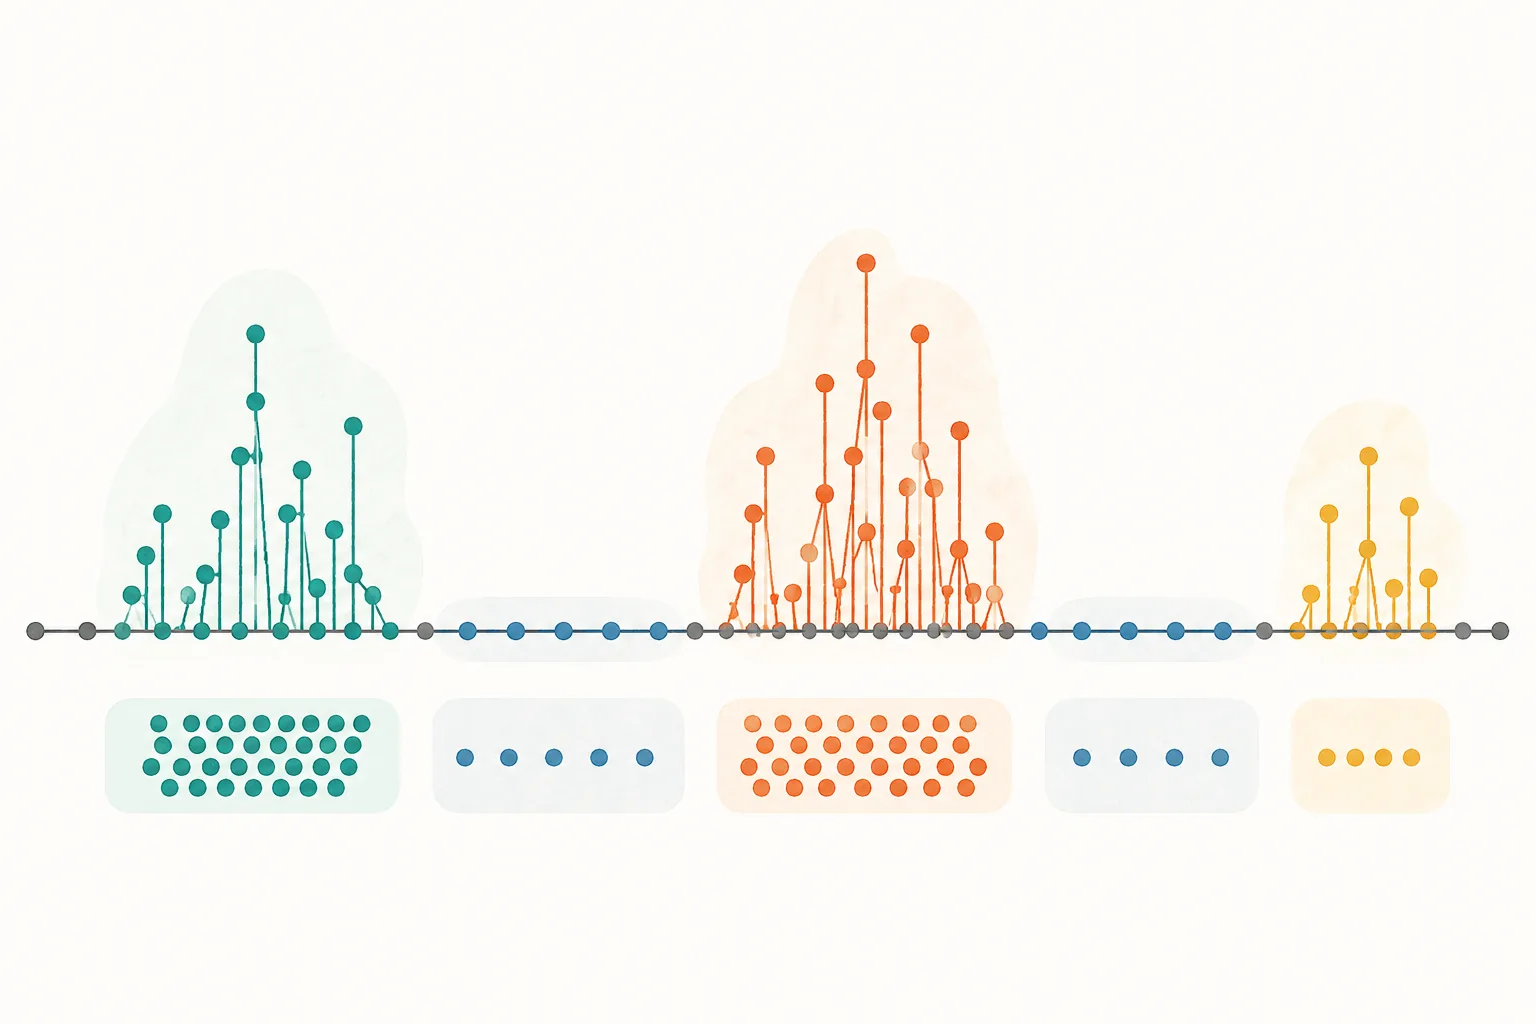
Why it matters: the pattern that reads as manufactured is discontinuity rather than speed. Nothing for months, then a burst, then nothing is the shape to avoid. So is a perfectly uniform drip.
What to do with it: also calculate net rate. Gross acquisition minus lost domains. A site gaining six and losing four is growing at two, which is the figure that should drive planning.
Check 5 — Your own outbound profile
What: what your site links out to, and from where.
How: Ahrefs Site Explorer on your own domain, Outgoing Links, Linked Domains. Most site owners have never opened this report.
Why it matters: if you run exchanges, every placement puts a link on your site. A hundred placements later your outbound profile starts to resemble the thing you screen partners for. This is the check that catches you becoming what you are trying to avoid.
What to look for: concentration on a few pages rather than distribution across many. Any links or partners page — remove it, it is the oldest tell there is. Outbound links on your strongest pages, which should be protected. Anything pointing somewhere embarrassing that you have forgotten about.
Check 6 — Portfolio overlap
What: which partners appear on more than one of your properties.
How: intersect the referring domain lists for each site you manage. A spreadsheet match formula is sufficient.
Why it matters: this is the check almost nobody runs, because on a single site it does not apply and on a portfolio nobody is paying for it. If six sites draw from the same partner pool, you have built one link profile six times, and a problem with one property becomes a problem with all of them.
What to do with it: set an explicit overlap cap between any two properties, and enforce it in your allocation process rather than in your intentions. Also compare the curves side by side — six accounts accelerating in the same fortnight is a cross-property pattern that no individual account audit will surface, and it belongs with the other portfolio controls in the multi-site link building guide.
Check 7 — Referral traffic per link
What: which partners actually send visitors.
How: analytics, referral traffic by source, cross-referenced against your placement log.
Why it matters: it is the only directly attributable outcome available. Ranking effects are mediated through several steps you cannot observe; a visitor arriving from a partner site is a fact. It also proves the partner is a real site with a real audience, which is a claim worth being able to substantiate.
What to do with it: partners sending nothing over two quarters are worth deprioritising even if their metrics look fine. This is the check that separates sites with authority from sites with audiences.
What not to put in the audit
Toxicity scores. Proprietary heuristics, not Google signals, and frequently wrong in both directions. They generate work without generating information.
Total backlink counts. Fifty links from one site is one relationship. Track referring domains.
Domain Rating as a goal. It is a diagnostic. Optimising for it directly produces links that raise a number without moving a business.
A disavow decision, by default. An audit finding spam is not a reason to disavow — every profile contains some, and the tool is a slow-acting, hard-to-reverse intervention warranted in a narrow set of cases the advanced link exchange strategy guide sets out.
A worked quarter
A single site, DR 34, running exchange steadily for a year. Second quarterly audit.
Check 1 — survival. 47 links placed two quarters ago, 39 still live. Survival rate 83%. Of the eight lost: four from a partner site redesign, two from content pruning, one expired domain, one unexplained. The redesign losses were worth an email — three were restored.
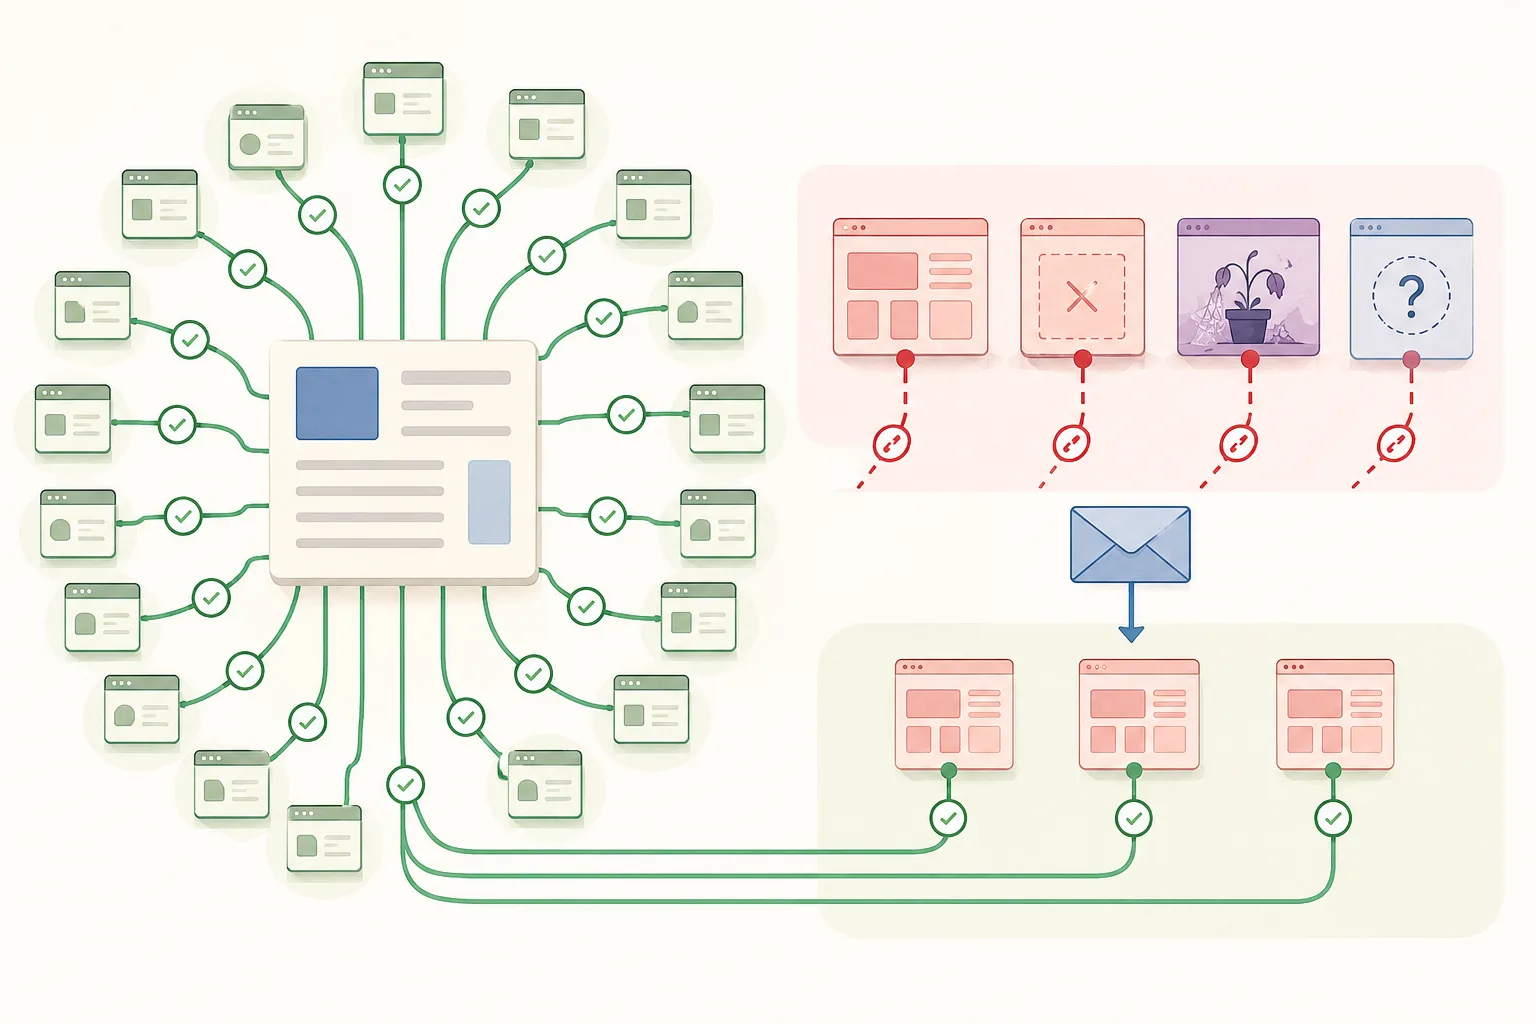
Check 2 — partner drift. Of twenty sampled partners, two had degraded. One added a write-for-us page with pricing since the last audit. One had gone from around 90 outbound linked domains to over 400. Both dropped from the pool; existing links left in place.
Check 3 — anchors. The main commercial target sat at 31% exact match, up from 26% last quarter. Direction wrong. Action: stop requesting exact match on that page for two quarters and route new placements to branded and partial variants.
Check 4 — velocity. Gross acquisition averaged 7 domains a month. Losses averaged 2.7. Net rate 4.3, against a reported figure of 7 — a 39% overstatement that nobody had noticed because nobody was subtracting.
Check 5 — outbound. 62 outbound placements, of which 21 sat on the site’s four strongest pages. Action: rotate future placements onto mid-tier pages and protect the top four.
Check 6 — overlap. Single site, not applicable.
Check 7 — referral. Six partners accounted for 84% of referral sessions. Eleven sent nothing at all over two quarters despite acceptable metrics. Action: prioritise the six for repeat placements, deprioritise the eleven.
Total time: about ninety minutes.
The finding worth generalising is check 4. The programme had been reporting 7 new domains a month for a year. The real figure was 4.3. Nobody was lying — nobody was subtracting.
What the audit should produce
One page, five numbers, per property:
- Referring domains — total, new this quarter, lost this quarter
- Survival rate on links older than six months
- Exact-match share on each commercial target, with direction
- Net acquisition rate and curve shape
- Referral sessions from partner links
Plus a short list of actions: partners to drop, target pages needing anchor dilution, overlap breaches to correct, and anything in your own outbound profile that needs fixing.
Cadence, and the one exception
Quarterly is right for most of it. Two adjustments:
Monthly for survival and velocity if you are acquiring at any volume. These move continuously and catching a problem early is cheaper than correcting it later.
Immediately after any migration or redesign. Your own or a major partner’s. These events break links in bulk, and the fixes are cheapest while the changes are fresh.
The point of a fixed cadence is that the problems this catches are all slow ones. Nothing here fails suddenly. Anchor ratios drift, partners degrade, links disappear, curves synchronise — each one a small change that nobody notices until eighteen months of them have accumulated into something that requires real work to undo.