Infographic Link Building: What Is It Exactly?
You know when you bring a magnet and use it to attract a certain metal object? This is exactly what infographic link building is all about. In today’s digital era, the content that you create has emerged as something that increases your visibility. Moreover, as something that enhances your ranking. Additionally, the art of link-building has emerged as a pivotal strategy for enhancing online visibility and search engine ranking. A subset of this strategy, known as infographic link-building, uses visual communication. That is, in tandem with strategic hyperlink placement to increase visibility and credibility for brands. Infographic link-building is all about making and sharing visually appealing images. Ones that have useful information. The goal is to grab people’s attention and get authority websites to link to them organically.
Infographics take advantage of people’s natural inclination to process information visually rather than in text. Simplifying and entertaining otherwise daunting amounts of material. In addition to improving SEO, this dynamic medium promotes social sharing and referral traffic. Which further increases the absorption of information. Infographics are also a great tool for content marketers. Especially those who want to build relationships with influential people in their field. That is, so that they may both benefit from it.
The purpose of this introductory section is to lay the groundwork for the rest of the article. Which will examine the complexities of infographic link-building. That is, by discussing its background, best practices, and possible influence on digital marketing tactics. By delving into its inner workings and practical uses, I hope to shed light on the relevance of this fresh strategy. One that emerged in the dynamic world of search engine optimization and online brand promotion.
Infographic Link Building: A Quick Overview
Infographic link-building is all about infographics. Obviously, I know. However, the meaning behind it all is that infographics are visualizations that are commonly crafted representations of data. They are often portrayed in a vibrant and comprehensible manner to facilitate easy reading and comprehension. Infographic link building is a strategy that people create in order to attract a variety of backlinks. Just like the function of the magnet that I mentioned before.
Graphic design is the process of creating visual representations of information. That is, in order to make otherwise difficult concepts easier to understand and work with. Marketers want to get people to notice and link to their infographics. That is why they post them all over the internet. Including on social media, blogs, and industry websites. Not only does this method raise awareness of the business. It also increases the authority of the website and its search engine results by attracting high-quality backlinks.
Let me give you an example: imagine with me a health and nutrition company. One that has a blog that helps people with nutrition plan tips. The infographic they use on their site might show the advantages of different food groups. Additionally, how to plan meals and important nutrition suggestions. After that, the business might share it on social media and team up with bloggers. Ones who focus on health and lifestyle to get their readers to share it. They could also send it to websites that are relevant to its target audience. That is to boost their internet presence and credibility. Only if they were able to attract backlinks from websites that were keen on promoting healthy content.
The Many Benefits of Infographic Link Building For Your SEO Strategy
Infographic link-building offers a plethora of benefits for enhancing your SEO (search engine optimization) strategy. Here is a list of the benefits that infographic link building offers you:
- Enhanced Engagement: Building links to infographics allows you to take advantage of the power of visual storytelling, which helps you attract the attention of your audience and encourages them to actively participate with your material.
- Improved Data Digestion: Complex information becomes more accessible and understandable when presented in visually appealing infographic formats, fostering better comprehension among your audience.
- Diverse Sharing Opportunities: Infographics are highly shareable across various digital platforms, including social media, blogs, and industry websites, facilitating broader dissemination of your content.
- Expanded Backlink Portfolio: Sharing infographics across diverse channels attracts inbound links from a wide array of sources, enriching your website’s backlink profile and signaling authority to search engines.
- Enhanced Search Engine Rankings: A robust backlink profile resulting from infographic link-building efforts contributes to improved search engine visibility and higher rankings for relevant keywords.
Additional Benefits That You Should Know About:
- Organic Traffic Growth: Higher search engine rankings translate to increased organic traffic as your website gains prominence in search engine results pages (SERPs), driving more qualified leads and potential customers to your site.
- Viral Potential: Compelling infographics have the capacity to go viral, exponentially amplifying your link-building efforts as they are shared widely across digital platforms and attract attention from diverse audiences.
- Establishment of Authority: By consistently producing high-quality infographics on topics relevant to your industry, you position your business as an authoritative voice and thought leader within your niche.
- Long-Term SEO Benefits: Infographic link-building contributes to sustained SEO performance, laying the groundwork for enduring visibility, credibility, and success in the competitive digital landscape.
The Challenges That You Might Meet With Infographic Link Building
While there are many benefits to be gained from infographic link development, there are also many hurdles involved in its execution. To begin, the creation of infographics that are both visually appealing and instructive demands a significant amount of time, resources, and creative expertise. Creating material that is not only interesting but also pertinent is another challenge that must be overcome. In addition, in order to effectively promote infographics, one must take a systematic approach.
An approach to interacting with and networking within the communities that are relevant to the promotion. In addition, obtaining backlinks from reputable websites can be difficult due to the presence of strong rivalry and the existence of different editorial standards. Additionally, assessing return on investment (ROI) and analyzing the performance of infographic link-building initiatives each have their own unique set of challenges. Despite these hurdles, it is possible to harness the enormous advantages of infographic link-building for search engine optimization methods by overcoming them through careful preparation, innovative implementation, and constant improvement.
Types of Infographics: No. 1: Timeline Infographics
Timeline infographics are graphical depictions of processes, events, or historical developments that show them in a linear fashion. Typically beginning at a fixed moment in time and moving consecutively towards the present or future, these visuals arrange data along a timeline.
Timeline infographics make use of a variety of visual components, like labels, images, and icons, to highlight important dates, milestones, and events within a specific era. For a variety of purposes and topics, they are useful tools for expressing intricate historical narratives and temporal relationships in a way that is accessible, interesting, and easy to understand.
Type No. 2: Statistical Infographics

Data visualizations with an emphasis on making statistical information simply digestible are known as statistical infographics. By utilizing visual aids such as charts, graphs, and diagrams, these infographics make it easy for viewers to understand intricate statistical data quickly and easily.
Bar graphs, pie charts, scatter plots, and histograms are some of the visualization techniques commonly used in statistical infographics to effectively portray quantitative data. They help disseminate statistical findings and insights to a wide audience and are widely used in research, education, media, and business.
Type No. 3: Comparison Infographics
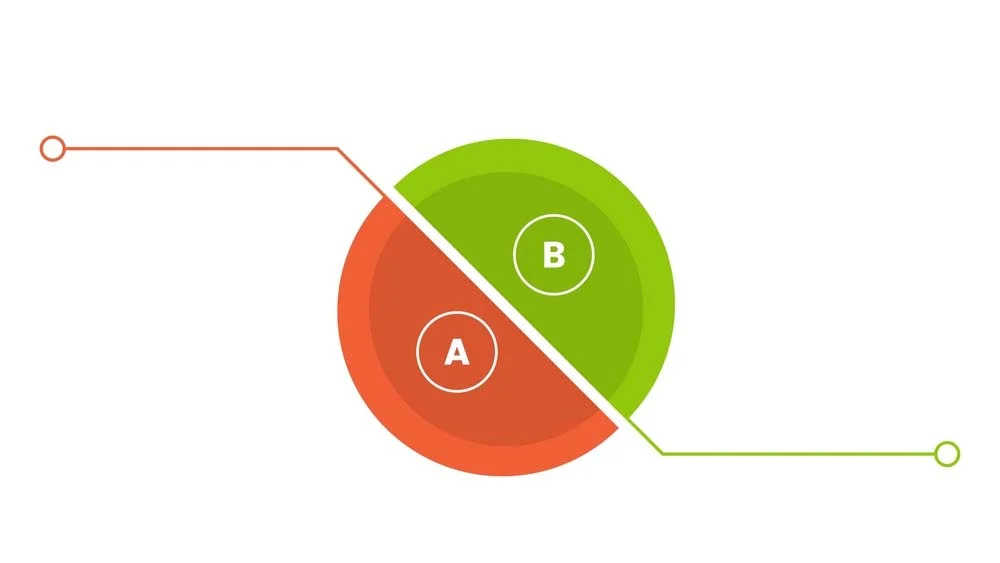
In order to concisely and engagingly show the similarities and contrasts between two or more elements, comparison infographics use visual representations. In order to make them easy to understand, these infographics usually include side-by-side layouts, contrasting colors, and labels.
Whether it’s comparing services, features, products, or ideas, comparison infographics help people understand the differences easily and make better choices. Effectively conveying complicated ideas, aiding in analysis, and facilitating decision-making processes across numerous contexts and industries, comparative infographics deliver information in a visually attractive way.
Type No. 4: Process Infographics
An infographic depicting a process is a visual representation of the activities that comprise a workflow, project, or activity. They simplify difficult procedures by dividing them into smaller, more manageable steps. Process infographics typically make use of symbols, images, and brief text to quickly walk readers through each step of the process. Infographics are a great way to explain complex processes to a wide range of people, whether it’s in the context of manufacturing, project management, or creating an instructional guide.
Type No. 5: Geographic Infographics
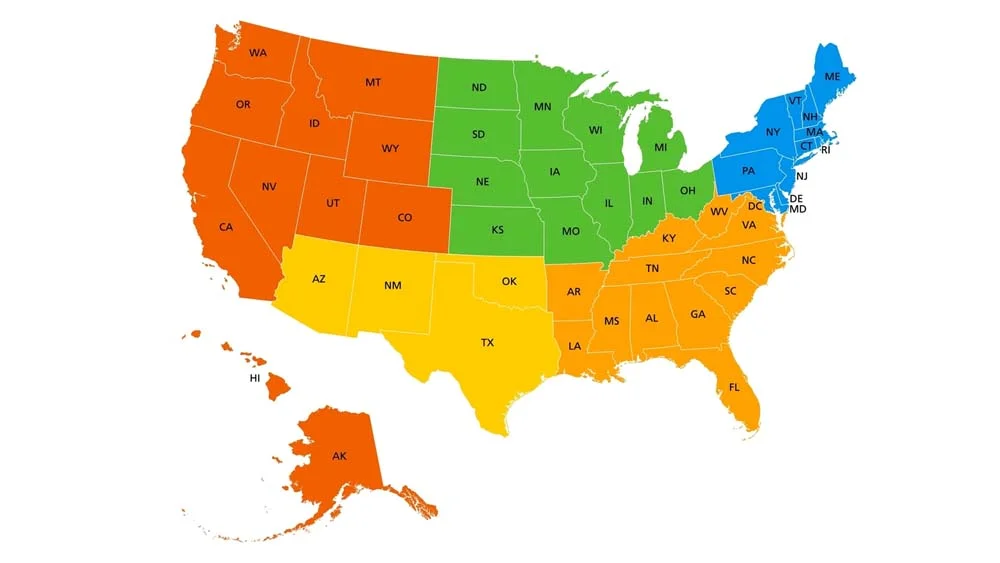
Infographics that center on geography, regions, or spatial linkages are called geographic infographics. These infographics present data on demographics, economic trends, environmental variables, and more for certain regions using visual components such as maps, charts, and graphs.
Geographic infographics simplify and clarify complex geographical and location-related information for a wide audience by displaying data in a spatial context, allowing viewers to better comprehend patterns, trends, and inequalities across various regions.
Type No. 6: List Infographics (Final Type)
A list infographic is a visual depiction of data presented in a list style, usually with numbers or bullet points. They simplify otherwise difficult-to-grasp information or concepts into a more manageable and aesthetically pleasing package.
To make list infographics more engaging and easy to read, designers often use symbols, pictures, and color schemes. Top ten lists, how-to instructions, comparisons, and any data that lends itself to a tiered or chronological layout are typical examples of the kinds of information that these infographics portray.
Wrapping It Up!
Infographics help us empower our SEO strategy in ways that we didn’t know were that important. I know that some people may say that link-building may be outdated. They may even think that it is not a very commonly used strategy for SEO. However, when implemented correctly, the results you are met with are ones that are of great achievement. If you wish to interconnect with reputable platforms with high domain authority, you can take a look at our link exchange domain: linkexchange.ai. It will help you with services like guest posting, author posting, link insertion, and link exchange, of course.